How to Generate and Customize Dashboard Reports in Tally Prime
In Tally Prime, the Dashboard feature provides a visual overview of financial and inventory-related metrics, which can be customized by adding specific tiles to reflect trends and summaries relevant to the business. Here's how to customize Dashboard reports in Tally Prime by adding different tiles for metrics such as Gross Profit Trend, Net Profit Trend, and company-wise comparisons.
Step-by-Step Guide to Customize Dashboard Reports in Tally Prime
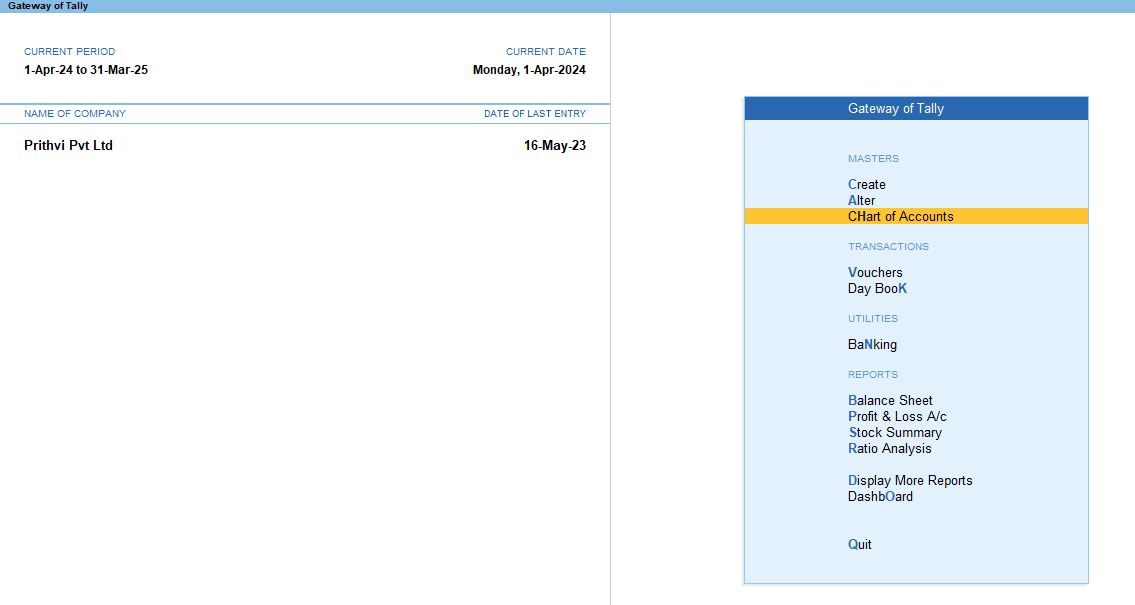
1. Select Company
Start by opening Tally Prime and selecting the relevant company for which you wish to create dashboard reports.
2. Add a Tile for Gross Profit Trend
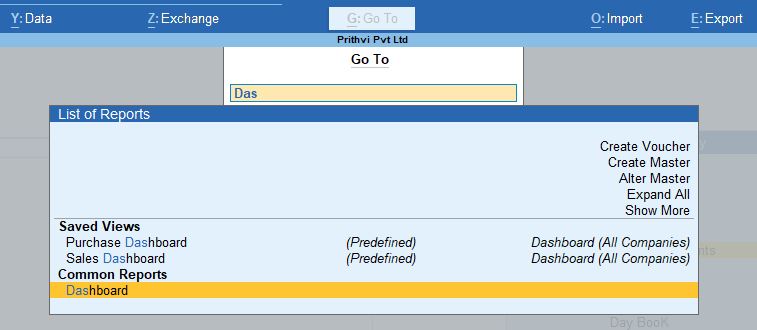
- Press Alt + G to access the Go To menu.
- Select Dashboard to open the Dashboard view.
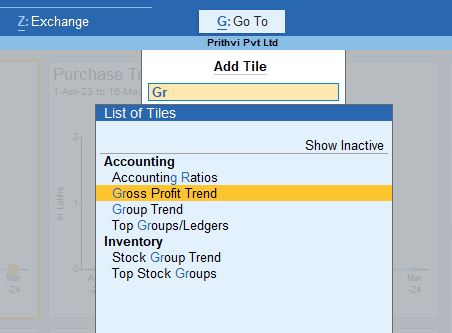
- Press Alt + A to Add Tile.
- Choose Gross Profit Trend as the tile to add.
Configure the Gross Profit Trend Tile
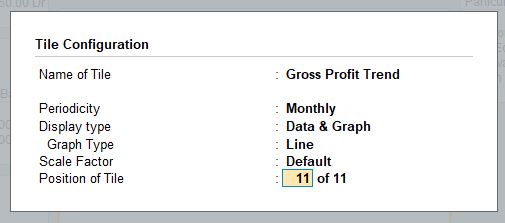
- Alt + C to configure the tile.
- Set the parameters as follows:
- Name of Tile: Gross Profit Trend
- Periodicity: Quarterly (you can choose other periodicities as well, like monthly or yearly).
- Display Type: Data & Graph (displays both data points and a graph).
- Graph Type: Line (shows a line graph).
- Scale Factor: Default
- Position of Tile: 11 of 11 (this determines the position of the tile on the dashboard).
3. Stock Item Monthly Configuration
Once in the Stock – Item view:
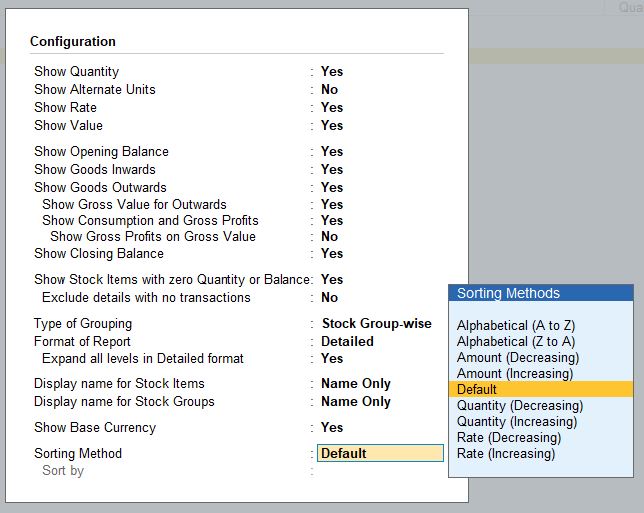
- Press F6 to switch to Monthly stock reports.
- Press F12 to configure the stock report display settings.

Configure Stock Report Display Settings
- Show Quantity: Yes
- Show Alternative Units: No
- Show Rate: Yes
- Show Value: Yes
- Show Opening Balance: Yes
- Show Goods Inwards: Yes
- Show Goods Outwards: Yes
- Show Gross Value for Outwards: No
- Show Consumption and Gross Profits: No
- Show Closing Balance: Yes
- Show Stock Item with Zero Quantity or Balance: Yes
- Type of Grouping: Stock Item-wise
- Format of Report: Detailed
- Display Name for Stock Items: Name Only
- Display Name for Stock Groups: Name Only
- Show Base Currency: No
- Sorting Method: Default
These settings will give a detailed and customized view of stock items and their movements, helping to track inventory performance.
4. Add a Tile for Net Profit Trend
- Return to the Dashboard using Alt + G.
- Press Alt + A to add another tile, this time for Net Profit Trend.
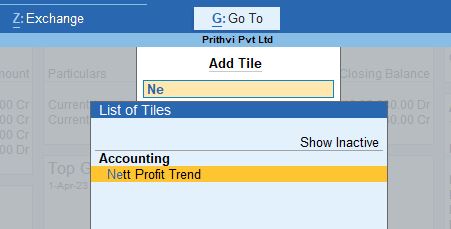
Configure the Net Profit Trend Tile
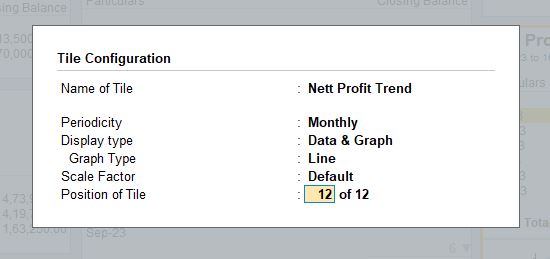
- Alt + C to configure the tile.
- Set the parameters as follows:
- Name of Tile: Net Profit Trend
- Periodicity: Quarterly
- Display Type: Data & Graph
- Graph Type: Bar (displays a bar graph).
- Scale Factor: Default
- Position of Tile: 11 of 11
This tile will help you track the company's net profit over different quarters, providing an easy-to-read graphical representation.
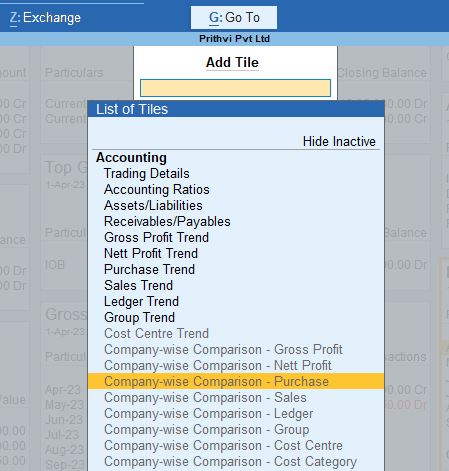
5. Add a Tile for Company-Wise Comparison – Purchase
- Press Alt + G to access the Go To menu.
- Go to Dashboard, and press Alt + A to add a tile for Company-wise Comparison – Purchase.
- Enter to select the Purchase Voucher Register for comparative data.

6. Add a Tile for Company-Wise Comparison – Sales
- Again, press Alt + G to access the Go To menu.
- Add a tile for Company-wise Comparison – Sales.
- Enter to select the Sales Voucher Register.
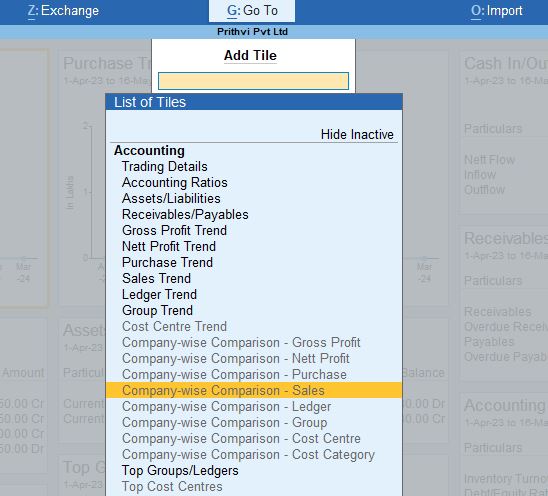

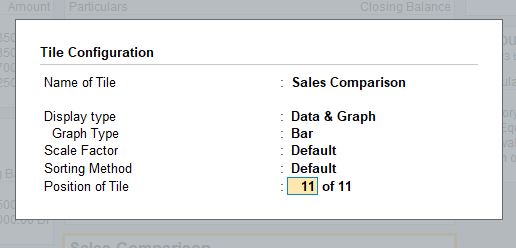
Configure the Sales Comparison Tile
- Alt + C to configure the tile.
- Set the parameters as follows:
- Name of Tile: Sales Comparison
- Display Type: Data & Graph
- Graph Type: Line (shows a line graph for visual comparison).
- Scale Factor: Default
- Sorting Method: Default
- Position of Tile: 11 of 11
This tile will show a comparison of sales across different periods or between different companies.
Conclusion
Customizing the dashboard in Tally Prime allows you to create insightful visualizations of important business metrics like Gross Profit, Net Profit, and Sales/Purchase Comparisons. By configuring the tiles according to your needs, you can easily monitor the company’s performance and make informed decisions based on trends. These reports are crucial for financial and inventory management, offering a blend of data and graphical representations to simplify analysis.
Tally Prime
Learn All in Tamil © Designed & Developed By Tutor Joes | Privacy Policy | Terms & Conditions