Stock Item Dashboard Reports in Tally Prime
In Tally Prime, the Stock Item Dashboard Reports provide a detailed overview of inventory items and stock levels through visual tiles on the dashboard. This feature helps in monitoring and managing stock movement, inventory values, and trends for stock items or stock groups. Below is a detailed explanation of each step involved in setting up and managing Stock Item Dashboard Reports:
Open Tally Prime → Select Company
- Start by opening Tally Prime and selecting the company you want to work with. Once the company is selected, you can access the various reports and vouchers.
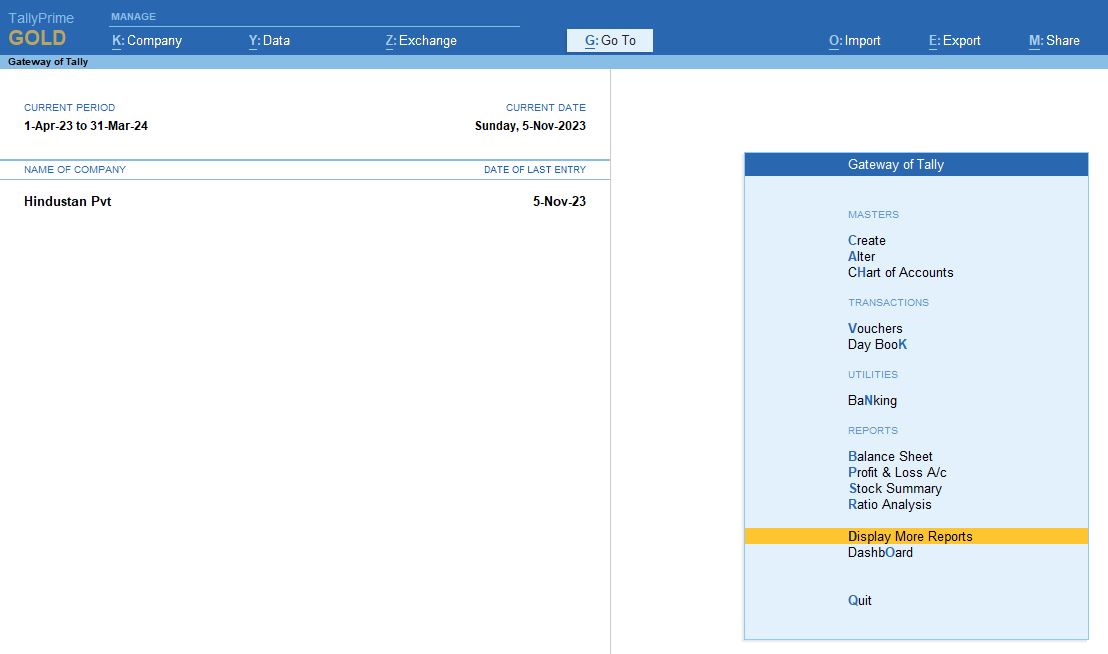
1. Gateway of Tally → Chart of Accounts → Inventory Masters → Stock Item
- From the Gateway of Tally, navigate to Chart of Accounts. This section allows access to various master data including inventory, ledgers, and cost centers.
- In Chart of Accounts, go to Inventory Masters and select Stock Item. This will display a List of Stock Items available in the system.
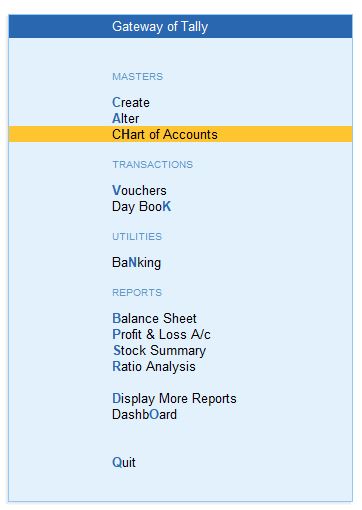
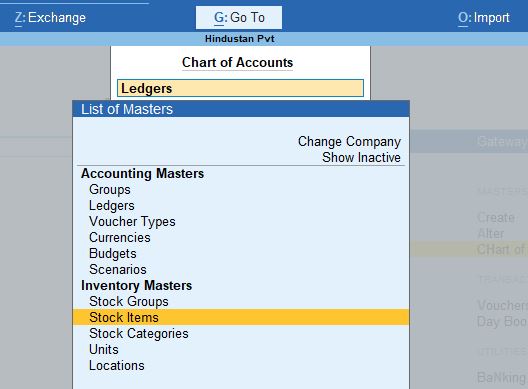
2. List of Stock Items → F5 (Stock Summary)
- When you're in the List of Stock Items, pressing F5 will bring up the Stock Summary. This report shows the current status of stock in hand, stock valuation, and other essential details.


3. Accessing the Dashboard → Alt + G → Dashboard
- To access the Dashboard in Tally Prime:
- Press Alt + G (Go To) and select Dashboard.
- The Dashboard is a customizable area where users can add different tiles to visualize important stock and inventory data.

4. Adding a Tile to the Dashboard → Alt + A (Add Tile)
- You can add specific tiles to the dashboard for better visualization of stock items and inventory data:
- Press Alt + A to Add Tile to the dashboard.
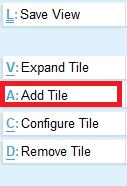
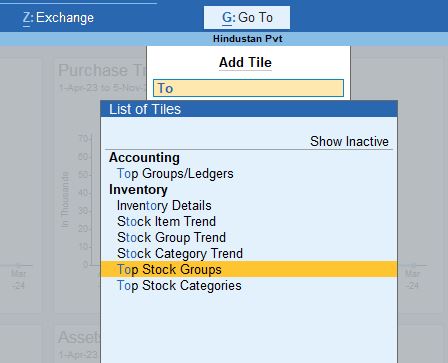
5. Configuring Tiles on the Dashboard
You can configure tiles to display different types of stock-related information. Here are two specific tile configurations:
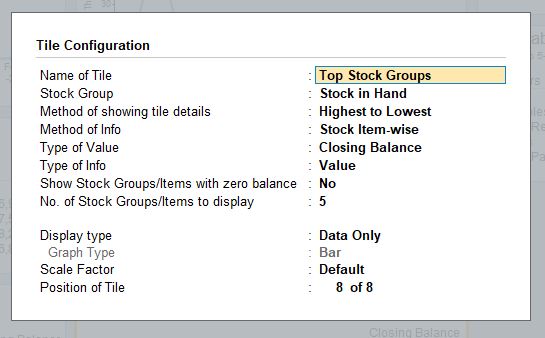
Tile Configuration 1: Top Stock Group
- This configuration displays the stock groups with the highest stock in hand.
Tile Configuration Settings:
- Name of Tile: Top Stock Group
- Stock Group: Stock in Hand (shows the stock currently available in the warehouse)
- Method of Showing Tile Details: Highest to lowest (the stock group with the most items will be shown first)
- Method of Info: Stock Item-wise (shows information at the stock item level)
- Type of Value: Inwards (displays incoming stock)
- Type of Info: Value (displays the monetary value of the stock)
- Show Stock Group/Items with Zero Balance: Yes (includes stock groups or items with zero stock in the list)
- No. of Stock Groups/Items to Display: 5 (displays the top 5 stock groups)
- Display Type:Data & Graph (includes both numeric data and a graphical representation)
- Graph Type: Bar (bar chart representation of the stock)
- Scale Factor: Default (uses the default scale for values)
- Position of Tile: 8 of 8 (sets the position of the tile on the dashboard)
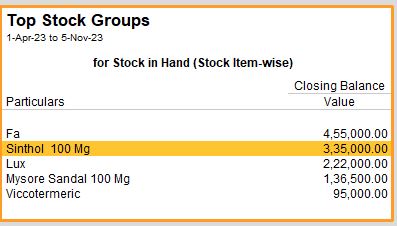
Tile Configuration 2: Top Stock Group (Outwards)
- This configuration displays stock items based on outwards (items moving out of the stock).
Tile Configuration Settings:
- Name of Tile: Top Stock Group
- Stock Group: Stock in Hand
- Method of Showing Tile Details: Highest to lowest (sorted from the most to least outgoing stock)
- Method of Info: Stock Item-wise (information about individual stock items)
- Type of Value: Outwards (displays outgoing stock)
- Type of Info: Value (shows the monetary value of outgoing stock)
- Show Stock Group/Items with Zero Balance: Yes (includes items with no outgoing stock)
- No. of Stock Groups/Items to Display: 20 (displays the top 20 stock groups)
- Display Type: Data Only (displays only numeric data, no graphs)
- Graph Type: Bar (optional here as display type is data only)
- Scale Factor: Default
- Position of Tile: 11 of 11 (position on the dashboard)
6. Stock Item Trend
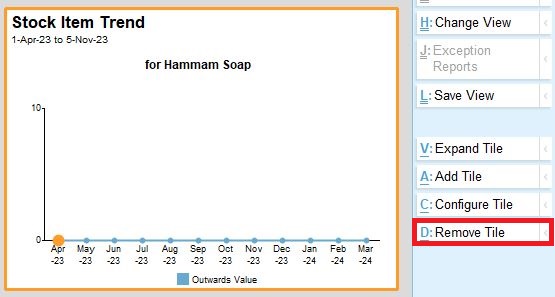
- The Stock Item Trend tile shows the trend for a specific stock item over a defined period (e.g., monthly, quarterly).
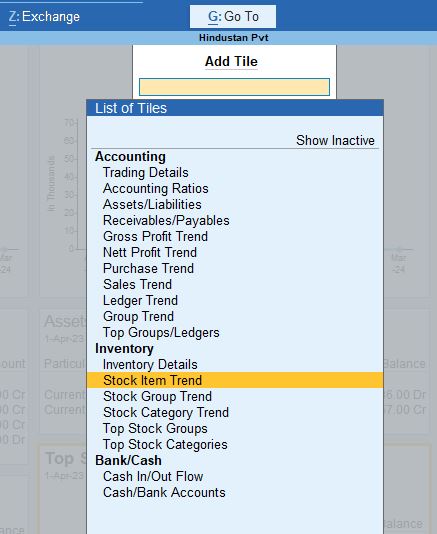
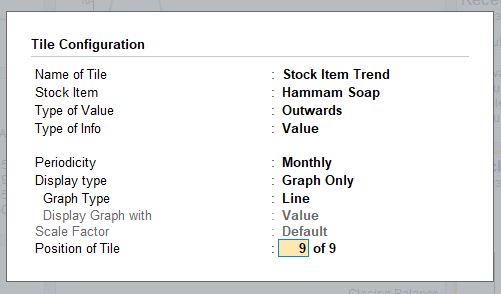
Tile Configuration for Stock Item Trend:
- Name of Tile: Stock Item Trend
- Stock Item: Hammam Soap (or any other stock item you want to track)
- Type of Value: Outwards (shows the outgoing stock)
- Type of Info: Quantity & Value (displays both the quantity and monetary value of the outgoing stock)
- Periodicity: Monthly (shows stock movement trends on a monthly basis)
- Display Type: Data & Graph (includes both data and a graphical trend representation)
- Graph Type: Bar (bar chart representation of the stock trend)
- Display Graph with: Value (the graph will be plotted based on the stock value)
- Scale Factor: Default (uses the default scale)
- Position of Tile: 9 of 9 (sets the position of the tile on the dashboard)
7. Removing a Tile → Alt + D
- If you no longer need a specific tile on your dashboard, you can remove it by pressing Alt + D and selecting the tile to remove.
Summary of the Stock Item Dashboard Reports in Tally Prime:
- Stock Item Dashboard allows you to monitor inventory trends and stock movements using tiles on the dashboard.
- Tiles can be customized to show stock data such as stock in hand, top stock groups, stock item trends, and inwards/outwards movements.
- Graphical representation using bar charts helps in visualizing stock trends for better decision-making.
- You can configure each tile’s display type, whether it shows data, graphs, or both, and you can adjust the position of the tiles on the dashboard.
- Tile Configuration settings allow for full customization based on the stock group, item, value, and periodicity (monthly, quarterly, etc.).
This dashboard provides a real-time overview of stock management, helping businesses maintain better control over their inventory and plan accordingly.
Tally Prime
Learn All in Tamil © Designed & Developed By Tutor Joes | Privacy Policy | Terms & Conditions