Stock Summary Reports in Tally Prime
The Stock Summary report in Tally Prime provides a detailed view of the inventory movement and valuation, allowing businesses to track stock levels, analyze profit margins, and monitor stock movement in terms of quantities and values. It helps manage the stock-in-hand, evaluate purchase and sales patterns, and gain insights into the financial performance of inventory items.
Stock Summary Access:
Gateway of Tally
This is the main screen of Tally, providing access to all modules such as Accounting, Inventory, Payroll, etc.
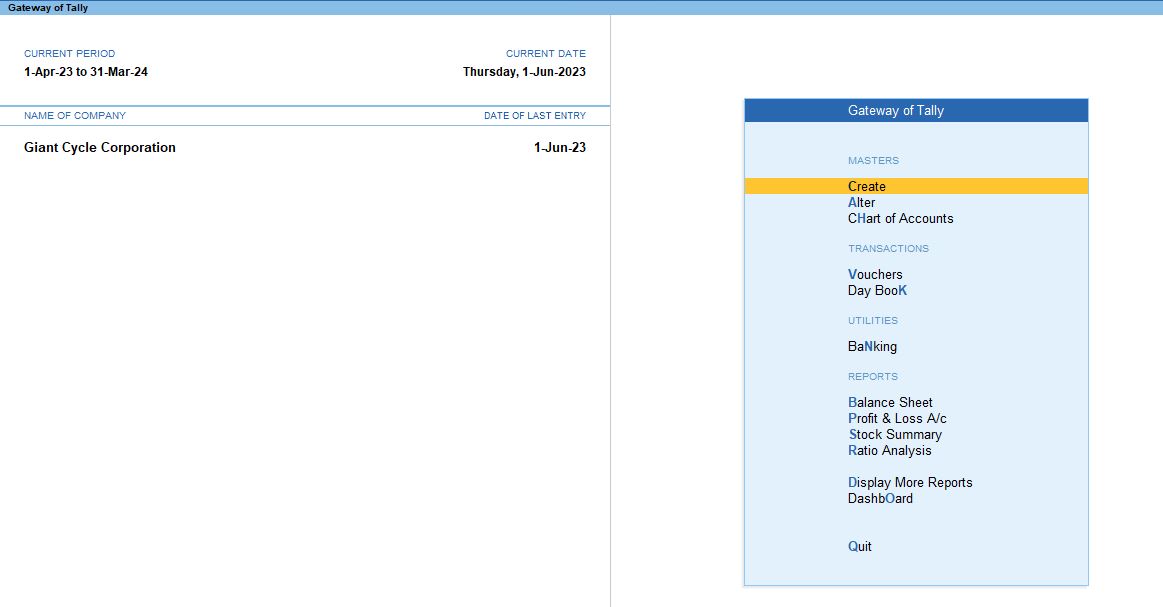
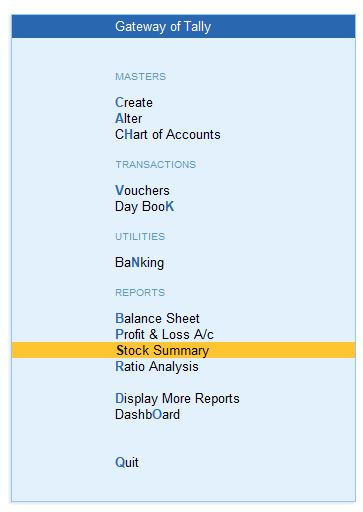
Stock Summary
- Navigate to Gateway of Tally → Stock Summary.
- Stock Summary provides an overview of all stock items, showing the quantities of items available in inventory and their values (based on the costing method chosen, such as FIFO, LIFO, etc.).
Stock in Hand
- Within Stock Summary, select the option Stock in Hand.
- This option gives a detailed report of the current quantity of stock on hand for each item, including total value.

Select Bicycle
- From the list of stock items displayed, you can select the item "Bicycle" to view more specific details about its stock movement.

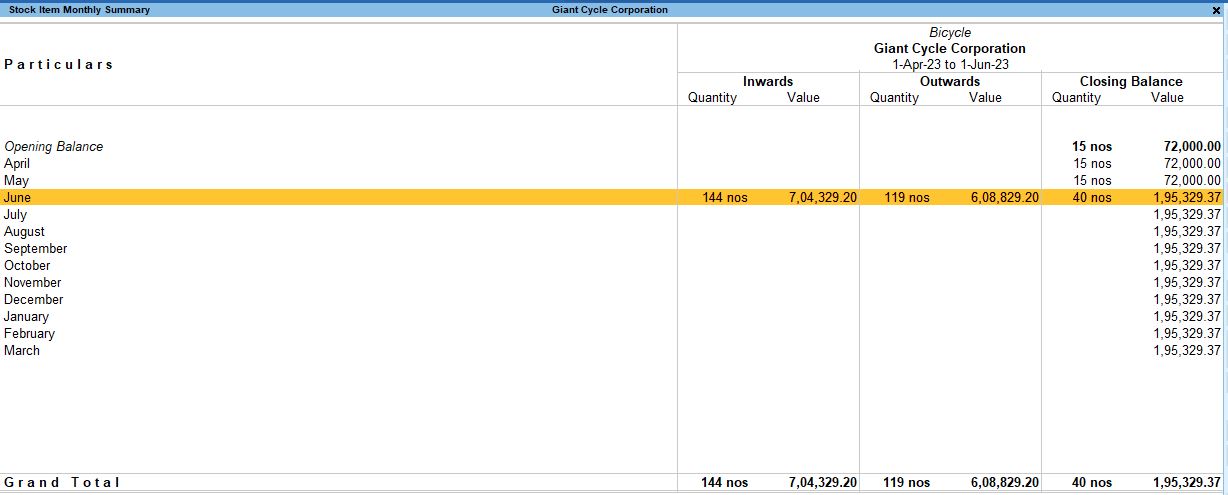
Stock Item Monthly Summary
- After selecting the Bicycle stock item, Tally displays the Monthly Summary.
- This report breaks down the stock item’s movement (inward, outward, closing stock) on a month-to-month basis. It shows how much stock came in (purchases), went out (sales), and the closing balance at the end of each month.
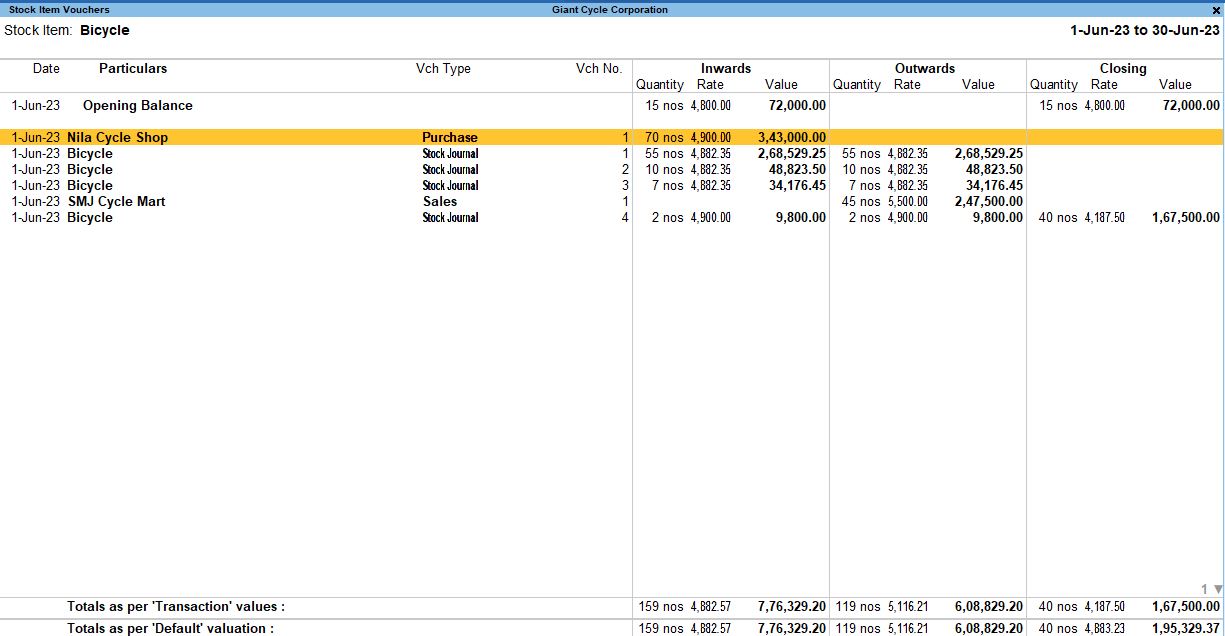
Stock Item Voucher
- If you want to drill down further, you can go to a specific month and press Enter to view the Stock Item Voucher details.
- This report shows all the vouchers related to the selected stock item for that specific month, including the dates, types of vouchers (purchase, sales, stock journals), and quantity involved in each transaction.

Summary of Details:
- Gateway of Tally → Stock Summary gives an overview of your stock.
- Stock in Hand shows real-time available quantities and values.
- Stock Item Monthly Summary gives a monthly breakdown of inward, outward, and balance stock for the selected item.
- Stock Item Voucher lets you view individual transactions (vouchers) related to the stock item in a specific period.
F7 - Show Profit:
By pressing F7, you can see the profit earned on the sale of the stock item. This view helps analyze the profit margins for individual stock items, giving insights into which products are performing well in terms of profitability.
Stock Group Summary Configuration (F12):
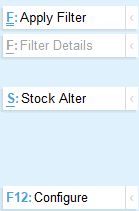
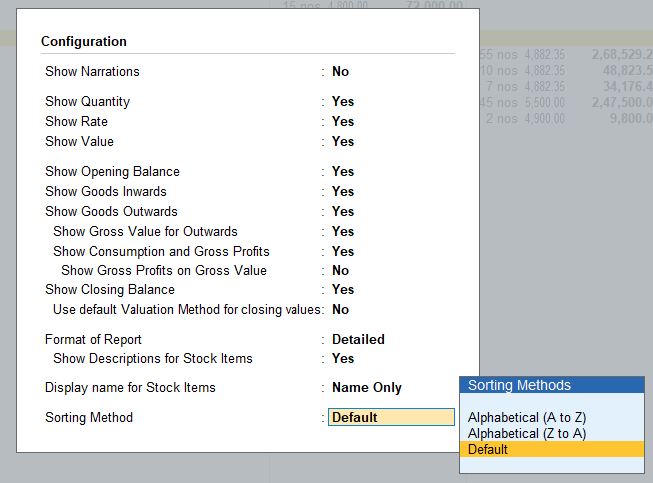
To customize the Stock Group Summary, press F12 (Configuration), and the following options will be available:
- Show Narrations: No (Exclude narrations to keep the report concise).
- Show Quantity: Yes (Displays the quantity of stock items).
- Show Rate: Yes (Shows the rate at which items are purchased/sold).
- Show Value: Yes (Shows the monetary value of the stock).
- Show Opening Balance: Yes (Displays the opening balance of the stock at the start of the period).
- Show Goods Inwards: Yes (Displays the quantity and value of stock coming in).
- Show Goods Outwards: Yes (Displays the quantity and value of stock going out).
- Show Gross Value for Outwards: Yes (Shows the total value of goods sold or moved out).
- Show Consumption and Gross Value: No (Not showing consumption, as it may not be relevant in all cases).
- Show Closing Balance: Yes (Shows the closing stock at the end of the period).
- Use Default Valuation Method for Closing Values: No (You can set a custom valuation method).
- Format of Report: Detailed (Provides detailed information for each item).
- Display Name for Stock Items: Name Only (Simplified view with stock item names).
- Sorting Method: Default (Standard sorting order).
Alternative View - Stock Group Summary:
To view the Stock Group Summary:
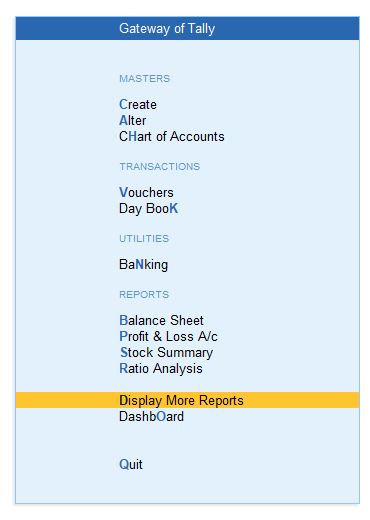
1. Display More Reports
- Navigate to Gateway of Tally → Display More Reports.
- Display More Reports provides access to various predefined reports available in Tally. These reports help you analyze financial and inventory data in a detailed manner.
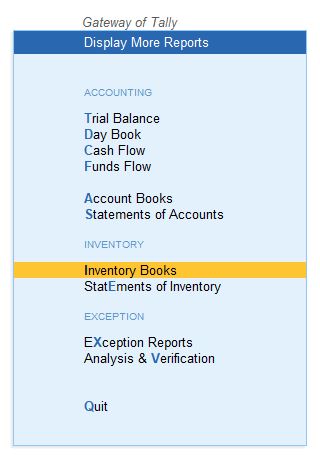
2. Inventory Books
- Under Display More Reports, select Inventory Books.
- The Inventory Books menu contains reports related to stock management and transactions involving inventory.
- This section offers various inventory reports such as Stock Registers, Stock Summary, Movement Analysis, Ageing Analysis, and others.
3. Stock Item or Stock Category Summary
Under Inventory Books, you have two specific options for inventory reports:
a. Stock Item Summary
- Stock Item Summary shows a detailed summary of all stock items you have.
- This report provides information about each stock item’s opening balance, inward stock (purchases or stock addition), outward stock (sales or stock reduction), and the closing balance, including the item's total value.
- It helps in analyzing individual stock items, their movement, and the quantity/value associated with them.
Steps to Access:
- Gateway of Tally → Display More Reports → Inventory Books → Stock Item Summary.
- From here, you can drill down into specific items to see further details like stock movements or vouchers.
Key Insights from the Stock Item Summary:
- Opening Quantity & Value: Shows the quantity and value of the stock at the beginning of the period.
- Inward: Displays the quantity and value of the stock that came in (e.g., through purchases or production).
- Outward: Displays the quantity and value of stock that went out (e.g., through sales, consumption).
- Closing Balance: Shows the final quantity and value of the stock item at the end of the period.
b. Stock Category Summary
- Stock Category Summary is similar to the Stock Item Summary, but it groups items under different categories.
- Categories in Tally help in organizing stock items that belong to similar groups, like raw materials, finished goods, etc. The report provides a summary for each category.
- You can monitor stock movement and value for each category instead of individual stock items.
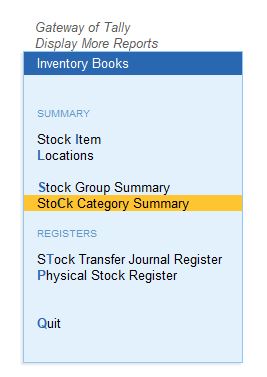
Steps to Access:
- Gateway of Tally → Display More Reports → Inventory Books → Stock Category Summary.
- From here, you can choose the category of interest and analyze the same parameters: opening, inward, outward, and closing balances for that category.
Key Insights from the Stock Category Summary:
- It offers a higher-level view of stock movement and balances by categories, helping you compare categories and understand overall trends in inventory.
Summary of Key Features:
- Stock Item Summary gives detailed stock movement and balances for individual stock items.
- Stock Category Summary organizes items into categories, showing overall stock movement and balances for groups of items.
- Both reports help in tracking inventory efficiently, monitoring the flow of goods in and out, and assessing stock value.
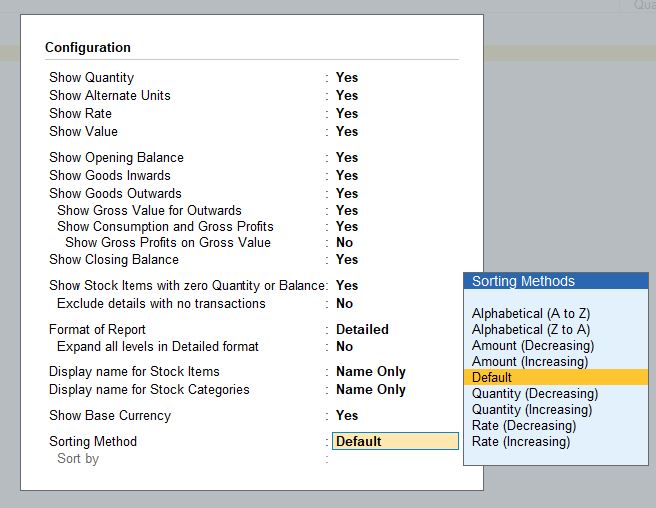
Stock Category Summary Configuration (F12):
Here, you can configure how stock categories are displayed in the Stock Category Summary report.
- how Quantity: Yes (Display the quantities of stock items).
- how Alternative Units: Yes (Shows the alternative units of measurement, if any).
- how Rate: Yes (Shows the rate of stock items).
- how Value: Yes (Displays the value of stock items).
- how Opening Balance: Yes (Displays the opening balance of the stock at the start).
- how Goods Inwards: Yes (Shows the inflow of goods).
- how Goods Outwards: Yes (Shows the outflow of goods).
- how Gross Value for Outwards: Yes (Displays the gross value for goods outwards).
- how Consumption and Gross Value: No (Optional, if relevant for consumption analysis).
- Show Closing Balance: Yes (Displays the stock remaining at the end).
- Show Stock Items with Zero Quantity or Balance: Yes (Shows items even if their balance is zero, for full visibility).
- Format of Report: Detailed (For in-depth details).
- Display Name for Stock Items: Name Only (Simple view with just stock item names).
- Display Name for Stock Categories: Name Only (Shows only the names of stock categories).
- Sorting Method: Default (Default sorting is maintained for ease of reading).

How to Use These Reports:
- Stock Management: These reports are invaluable for tracking stock levels, understanding which items are moving fast, and identifying slow-moving or dead stock.
- Profit Analysis: Using the F7 Profit View, you can analyze the profitability of individual stock items and groups.
- Detailed Insights: With the Detailed Format of Reports, you can drill down into stock movements (inward and outward), helping you keep tight control over your inventory.
- Custom Valuation: You can switch the valuation methods for closing stock if needed, which helps in accurately determining your stock’s financial worth.
- Inventory Planning: By monitoring the opening and closing balances, businesses can plan future stock purchases more effectively, ensuring they maintain optimal stock levels.
Conclusion:
The Stock Summary Report and related views in Tally Prime provide comprehensive insights into stock management, helping businesses monitor inventory levels, profit margins, and stock movements. By using the configuration options, users can tailor the reports to their specific needs, making it easier to make data-driven decisions regarding inventory and profitability.
Tally Prime
Learn All in Tamil © Designed & Developed By Tutor Joes | Privacy Policy | Terms & Conditions